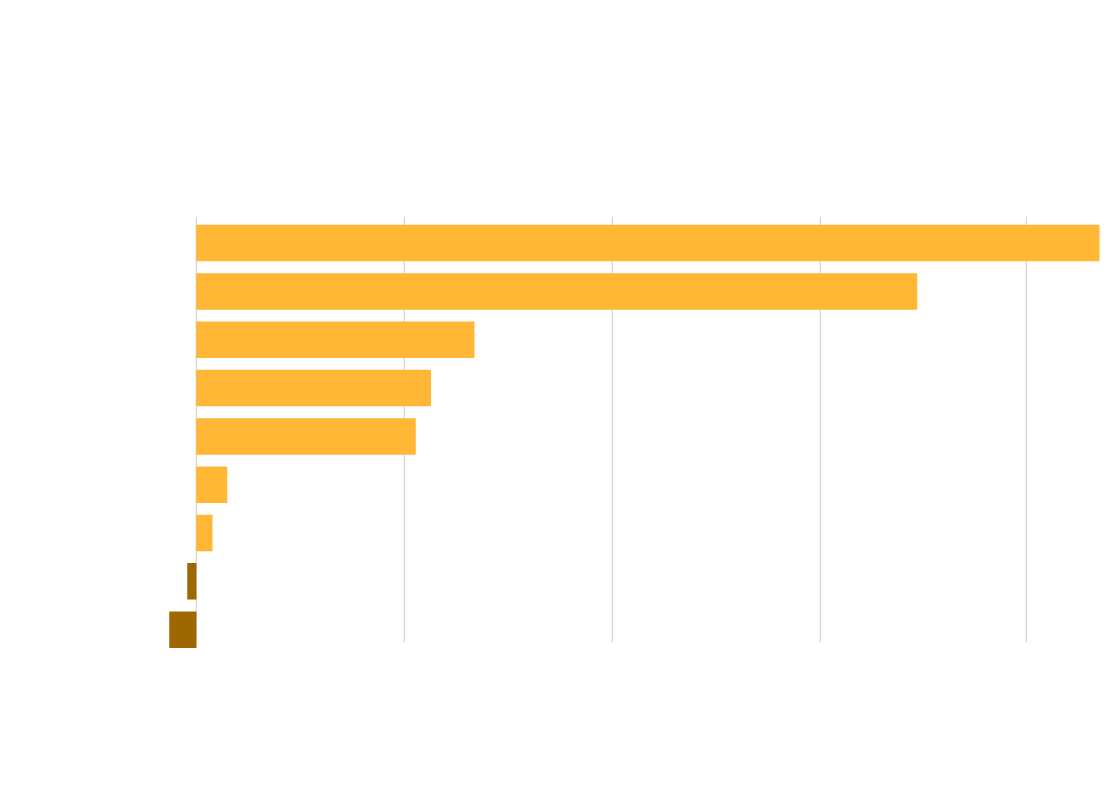
Kentucky’s population rose by 3.8% over the past decade.
Census shows that the state grew more diverse.
Chart shows percent change in population by race and ethnicity from 2010 to 2020.
50%
150%
Tripled
0%
Doubled
Other Race
Multiracial
Native Hawaiian and Other Pacific Islander
Hispanic
Asian
Black
Total Population
White
–2.2%
American Indian and Alaska Native
–6.5%
Note: As Hispanic is an ethnicity, in this analysis, we assumed it as a separate category.
All race categories are for non-Hispanic population.
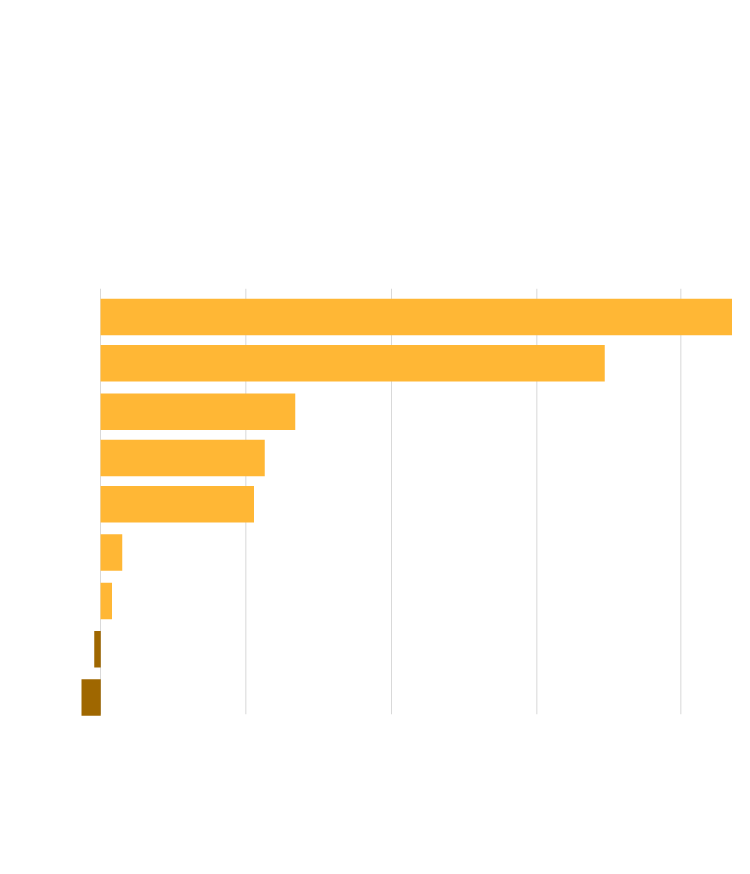
Kentucky’s population rose by 3.8% over the past decade. Census shows that the state grew more diverse.
Chart shows percent change in population by race
and ethnicity from 2010 to 2020.
0%
50%
Doubled
150%
Tripled
Other Race
Multiracial
Native Hawaiian and Other Pacific Islander
Hispanic
Asian
Black
Total Population
White
–2.2%
American Indian and Alaska Native
–6.5%
Note: As Hispanic is an ethnicity, in this analysis, we assumed it as a separate category. All race categories are for non-Hispanic population.
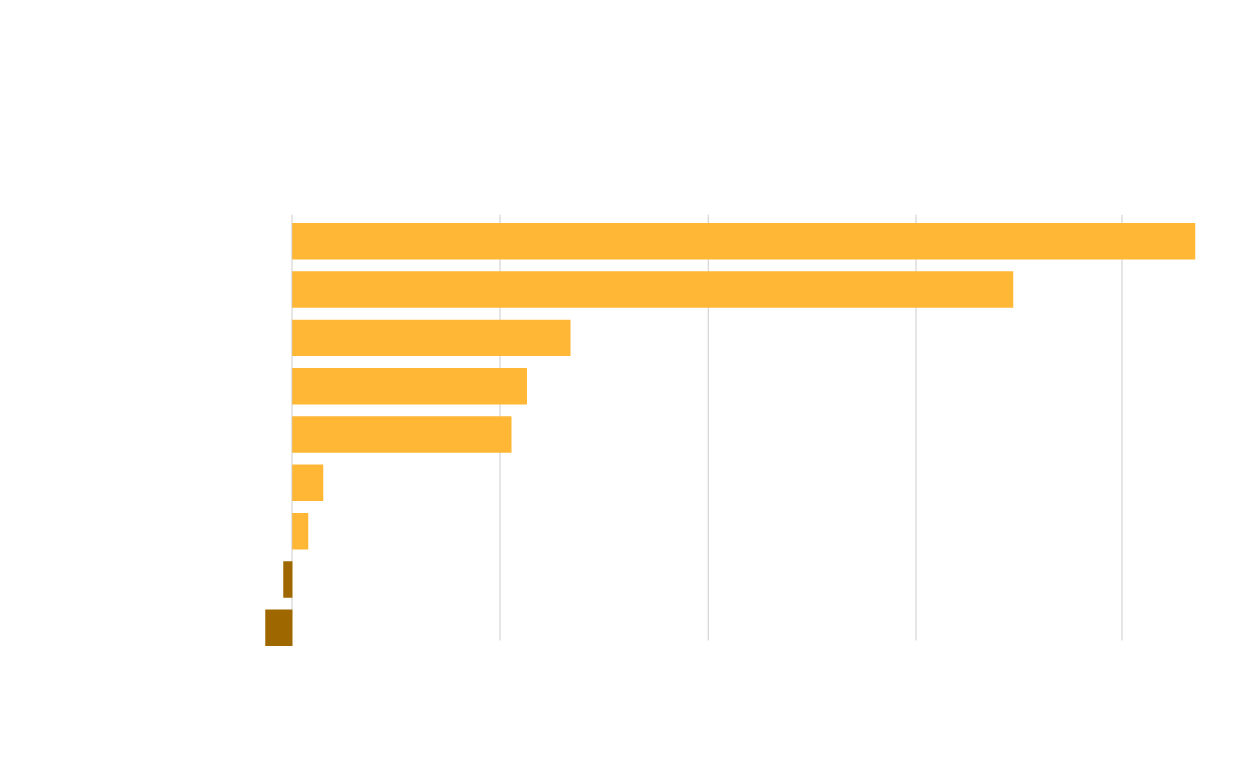
Kentucky’s population rose by 3.8% over the past decade. Census shows that the state grew more diverse.
Chart shows percent change in population by race and ethnicity from 2010 to 2020.
0%
50%
Doubled
150%
Tripled
Other Race
Multiracial
Native Hawaiian and Other Pacific Islander
Hispanic or Latino
Asian
Black
Total Population
White
–2.2%
American Indian and Alaska Native
–6.5%
Note: As Hispanic is an ethnicity, in this analysis, we assumed it as a separate category. All race categories are for non-Hispanic population.